|
Lab Gallery
|
|
|
|
|
|
|
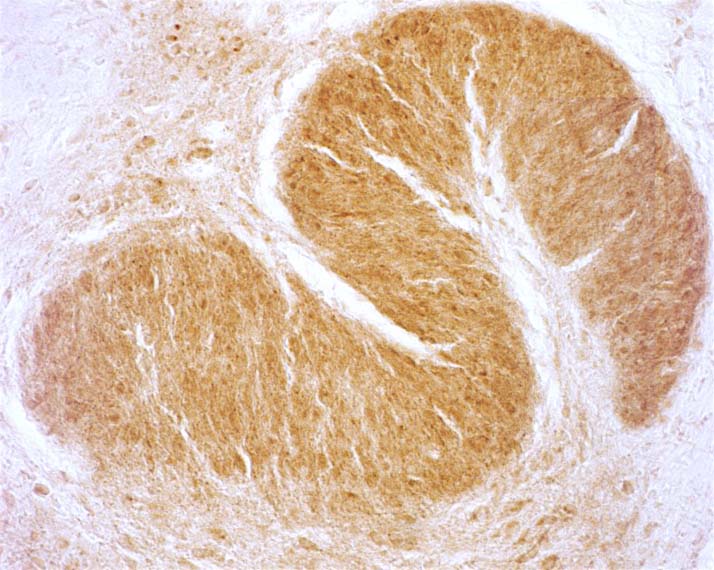 |
The LSO of rat stains intensely for
cytochrome oxidase activity. This original image was
digitally lightened for use in the banner above. Image credit E Bojman & A
Cooper
|
|
|
|
|
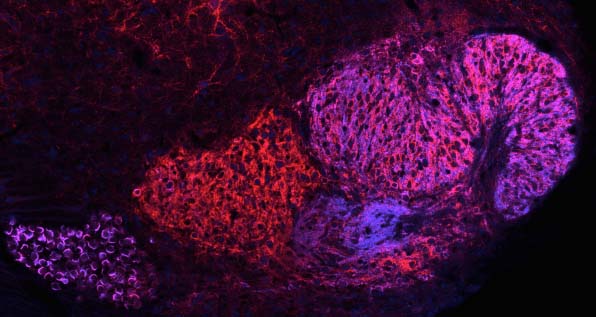
Immunofluorescence
micrograph of rat auditory brainstem (coronal section),
showing the expression of proteins VGLUT1 and Synaptotagmin
2. The LSO here measures about 500 µm left to right. See Cooper & Gillespie, 2011 for
more information. |
|
|
|
|
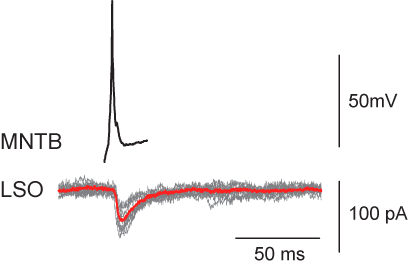
Paired
recording from synaptically connected MNTB and LSO principal
cells. While recording from the LSO neuron (bottom), neurons
in the MNTB are patched and stimulated (top). If the MNTB
neuron provides input to the LSO cell, we see a
post-synaptic current (red = average response). See Alamilla & Gillespie, 2011.
|
|
|
|
|
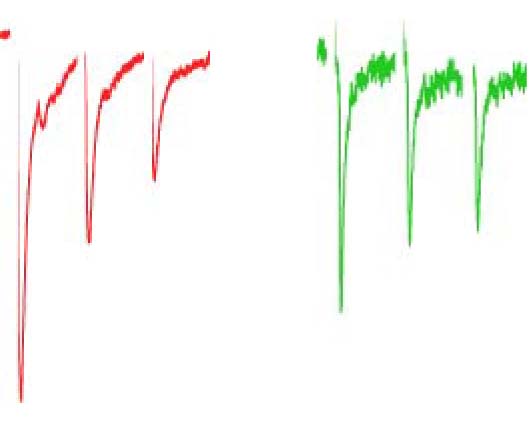
Paired-pulse
responses for inhibitory (red) and excitatory (green)
components of the MNTB input to the same LSO neuron.
Paired-pulse depression, an indirect indicator of
neurotransmitter release probability, is larger for the
green component. This apparent difference in release
probabilities suggests to us that whereas GABA, glycine,
glutamate are co-released from the same terminals, they are
released from different vesicles. See Case & Gillespie, 2011.
|
|
|
|
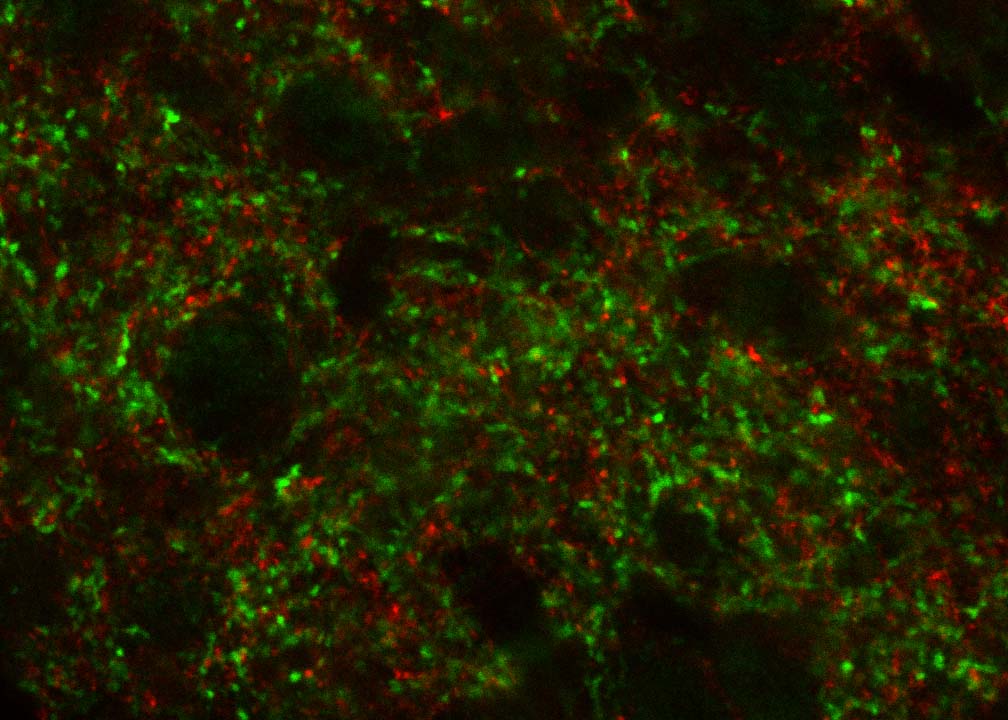 |
Higher magnification,
double-immunofluroescence for the presynaptic proteins
VGLUT1 (red) and Synaptotagmin 1 (green) in the LSO. Because
red and green label virtually never colocalize, we infer
that these proteins are targeted to different synaptic
terminals. See Cooper & Gillespie, 2011. |
|
|
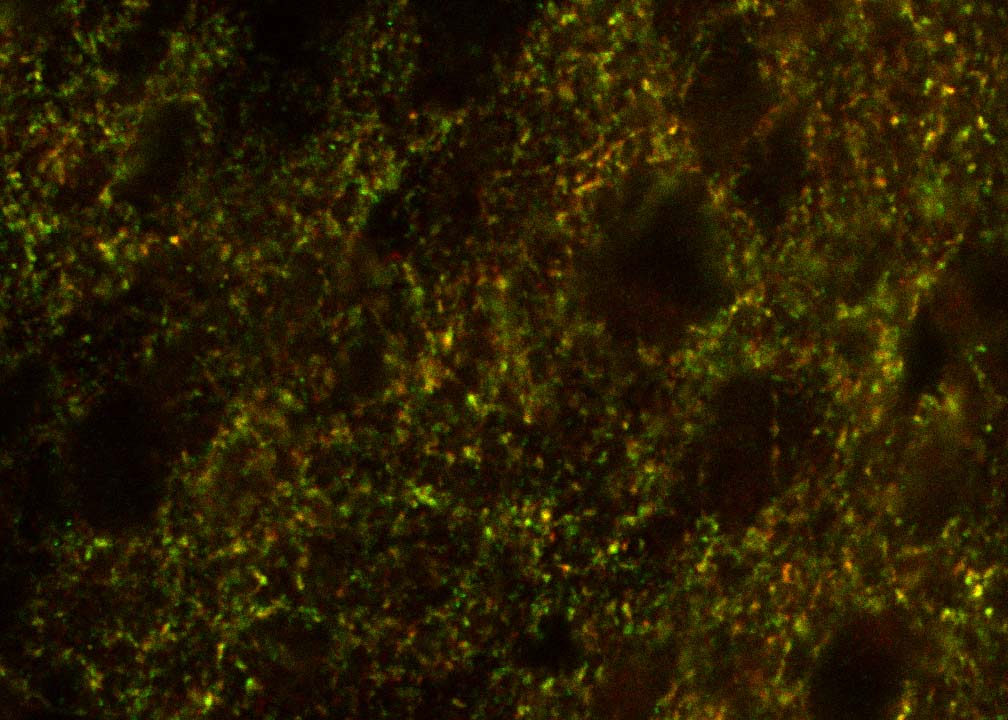 |
By contrast, the presynaptic proteins VGLUT3
(red) and Synaptotagmin 1 (green) colocalize extensively
(yellow) in the LSO, and we infer that these two proteins
are in the same synaptic terminals. See Cooper & Gillespie, 2011. |
|
|
|
|
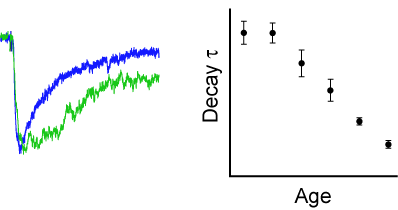
Post-synaptic
receptors exhibit characteristic kinetics, depending on
their subunit composition. At left are shown a glutamatergic
response recorded from a young cell (green) and one from an
older cell (blue). Developmental changes in the
time-constant of exponential decay allow us to infer changes
in receptor subunits with developmental age. See Case et al, 2011.
|
|
|
|
|
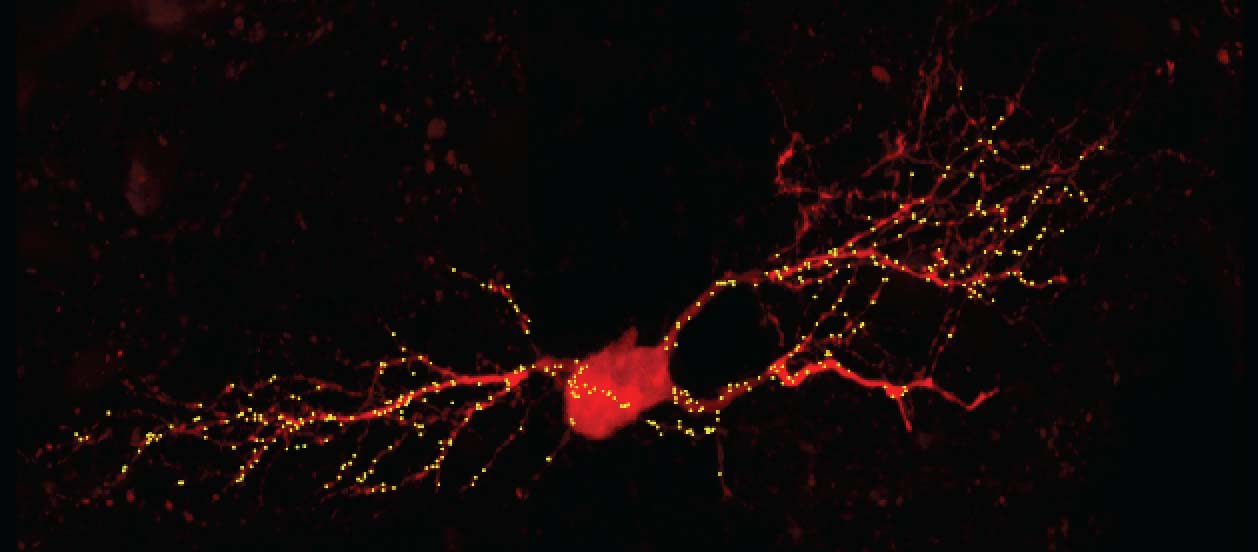
This cell in the LSO was visualized with a
fluorescent dye (red), and the location of inhibitory inputs
to the cell with immunofluorescence (yellow). Image credit A Cooper
|
|
|
|
|
|
|
|
|
|